Converting written questions into graphical representations can support students to better 'see' both the mathematical problem and reasoning required to solve the problem (Nunokawa, 2004; Bremigan 2005). Put another way, visual texts can be used to supplement words, numbers and mathematical concepts (Armstrong, Ming & Helf, 2018).
There are many methods teachers can use to support students to create graphical or visual representations to solve problems and communicate solutions.
Understanding this strategy
When teaching how to convert written questions into graphical or visual representations, teachers can model to students how to do this by thinking-aloud their reasoning to identify key terms in the problem statement that suggest a graphical representation may be helpful.
 Student example for mapping surface area
Example
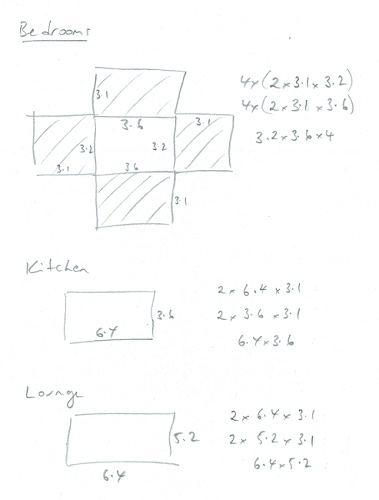
When teaching how to calculate the areas of composite shapes (VCMMG312), teachers can encourage students to draw individual shapes, as demonstrated below.
You want to repaint your house. It comprises 4 bedrooms, each measuring 3.2 m x 3.6 m. The open plan kitchen and dining room measure 3.6 x 6.4 m, and the lounge room measures 6.4 m x 5.2 m. You do not need to paint the bathroom or laundry. The ceiling is 3.1 m above the floor.
You need enough paint for two coats for the walls and ceiling. 1 L of paint will cover 2 m2.
Calculate how much paint you will need.
The dual scale number line
One strategy to use is the dual scale number Line (as shown below). The dual scale number Line is a proportional number line which can help students to summarise information from a proportional reasoning problem and then assist in solving (Dole, 1999). It requires students to transform written questions into visual representations, in order to solve a problem.
To do this, students need to learn to translate information from the problem onto the dual scale number line and use it to work towards a solution.
Using this strategy
Teachers should explicitly teach the features of the dual scale number line (as shown in the diagrams below) and model how to use it.
- draw a blank diagram
- populate with given information
- identify what information is missing
- determine a solution to the problem
Example using a dual scale number line
The following example shows the use of a dual scale number line in a Year 7 (VCMNA247,
VCMNA248) or a Year 8 (VCMNA276) class for the three types of percentage problems:
- Missing part
- Missing percentage
- Missing whole
The first and last diagrams are shown for these one-step problems.
 Missing part number line
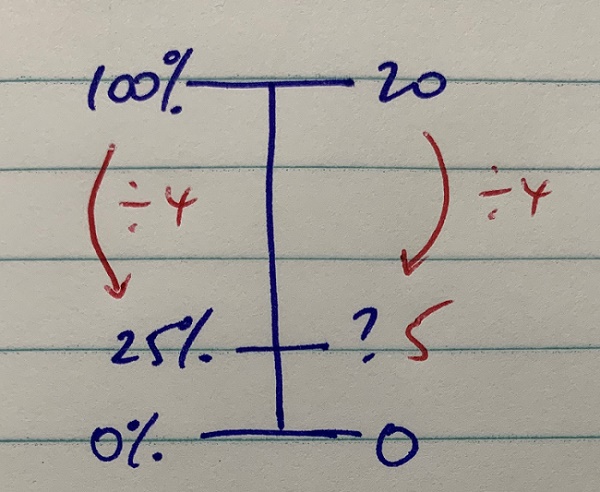
Missing part
I have twenty pieces of fruit in a bowl and twenty-five percent are apples. How many apples do I have?
 Missing percentage number line
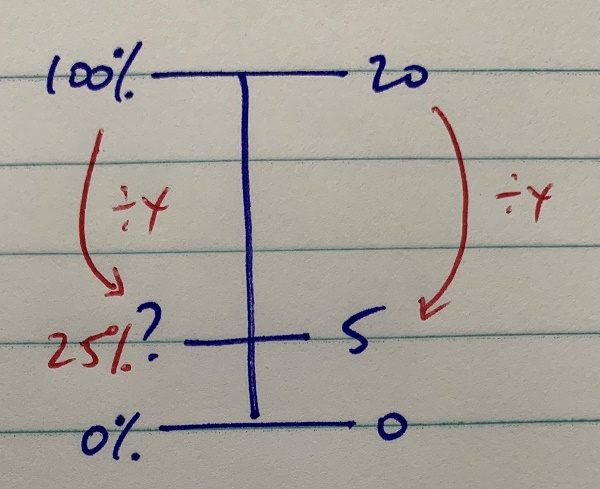
Missing percentage
I have twenty pieces of fruit in a bowl and five of these are apples. What percentage are apples?
 Missing whole number line
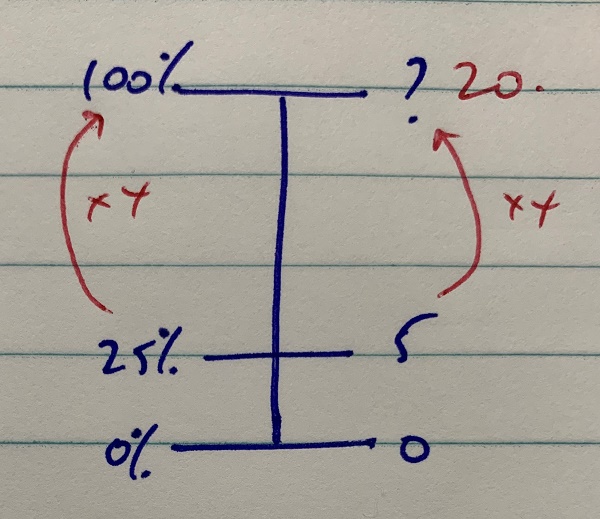
Missing whole
Twenty-five percent of the fruit in a bowl is apples. If there are five apples, how many pieces of fruit altogether?
Additional notes on the dual scale number line
The dual scale number line can be used for any proportional calculation where zeroes of both quantities align.
In other words, it is not suitable for converting between Celsius and Fahrenheit as 0°C is 32°F.
Discuss with students that it is useful to look for easy numbers to use in calculations, but that a unitary method (i.e. consider 1% or 1 unit of quantity) will work for any example.
For example, to find 17% of a quantity a student might use a unitary method, first determining 1% of the quantity and then finding 17%.
For diagrams, students will need to be aware of the particular terminology that is useful for discussing the diagram. In this case, the terms 'proportional' and 'unitary' are useful. Students should be encouraged to record these words and describe their meaning.
The teacher should provide further examples of more complicated, multi-step problems.
For example, if a student is asked to find 23% of $125, they can set up the dual scale number line showing the given information and then use the unitary method to find 1% of $125 (i.e., $1.25).
Multiplying both sides by 23 then shows that 23% of $125 is $28.75.
The Dual Scale Number Line can be useful for finding more than 100%.
For example, when increasing a quantity by 30% it is useful to find 10% (by dividing 100% and the given quantity by 10) and then multiplying by 13 to give 130%. Alternatively it is possible to use the unitary method and divide by 100 to give 1% and then multiply by 130.
This approach, focussing on multiplication and division only, is different to determining 30% and adding to the 100%.
The reason for focussing on multiplication and division only on this diagram is that students will need to eventually recognise that these two steps (i.e. dividing by 10 and multiplying by 13) can be carried out as one step: "multiply by 1.3"; namely, that a 30% increase can be found by multiplying by 1.3.