The example below demonstrates how this strategy can be used in a Year 7 class on data representation and interpretation (VCMSP269).
Scenario
Consider an activity about rainfall at the Botanical Gardens. Ask students to visit the Bureau of Meteorology 'Information for students and teachers' website and download the data set on daily rainfall for the Melbourne Botanical Gardens for 2018 and 2019.
Students will need to download the chosen data sets onto their own device.
Teacher actions
Teacher asks students to identify the type of data their group has. Rainfall is a numerical and continuous variable. The teacher could ask students to focus on the rainfall in the given data sets.
Working with the data in Excel
Teacher asks students to use Excel to produce several charts to display their data.
Encourage students to consider the type of display and what can be shown.
Teacher asks the students to consider the features of each of the charts they have produced and decide which charts are appropriate for the given data.
Two examples are shown below.
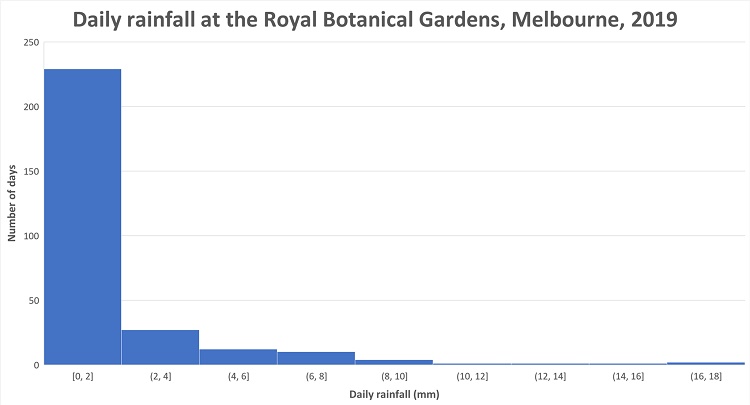
 Histogram one shows the number of days that received particular amounts of daily rainfall at the Royal Botanical Gardens, Melbourne, in 2019.
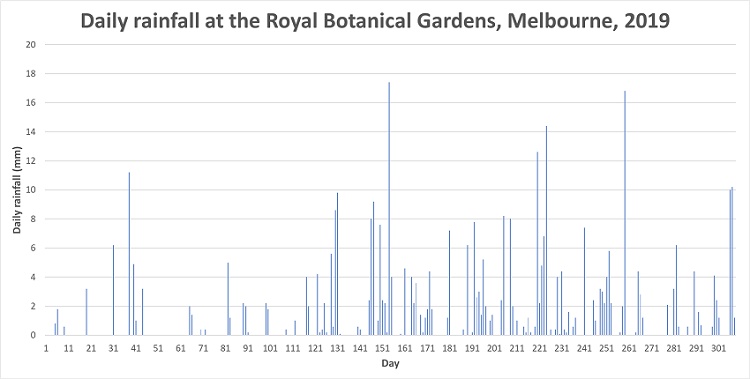
 Histogram two how much rain fell at the Royal Botanical Gardens on each day of the year in 2019. The intervals along the horizontal axis is 10 days.
Student Discussions
Students might discuss the bin size for the histogram and how helpful it is having intervals of 10 for the column graph.
Students might also discuss how the various charts help to represent the rainfall to enable them to make judgements about rainfall.
Discussion could centre about the information that is shown by a particular display and also what is not shown. For example, the first chart does not show rainfall over time, but does show that 0-2mm is the most frequent rainfall.
The teacher could ask various students to display their graphs using a data projector to prompt discussion of appropriateness of charts and interesting features of charts.
Ask students for any questions they have about given charts and any statements regarding what is shown by particular charts.